Our mission is to perform rigorous engineering analysis on the world’s most critical resource management challenges. Part of that mission is disseminating what we learn to the world. Click here to view our publications by theme and here to see recent media coverage and commentary.
Some highlights of our work are included below. If you have any trouble downloading a particular paper, please email Dr. Sanders at ktsanders@usc.edu.
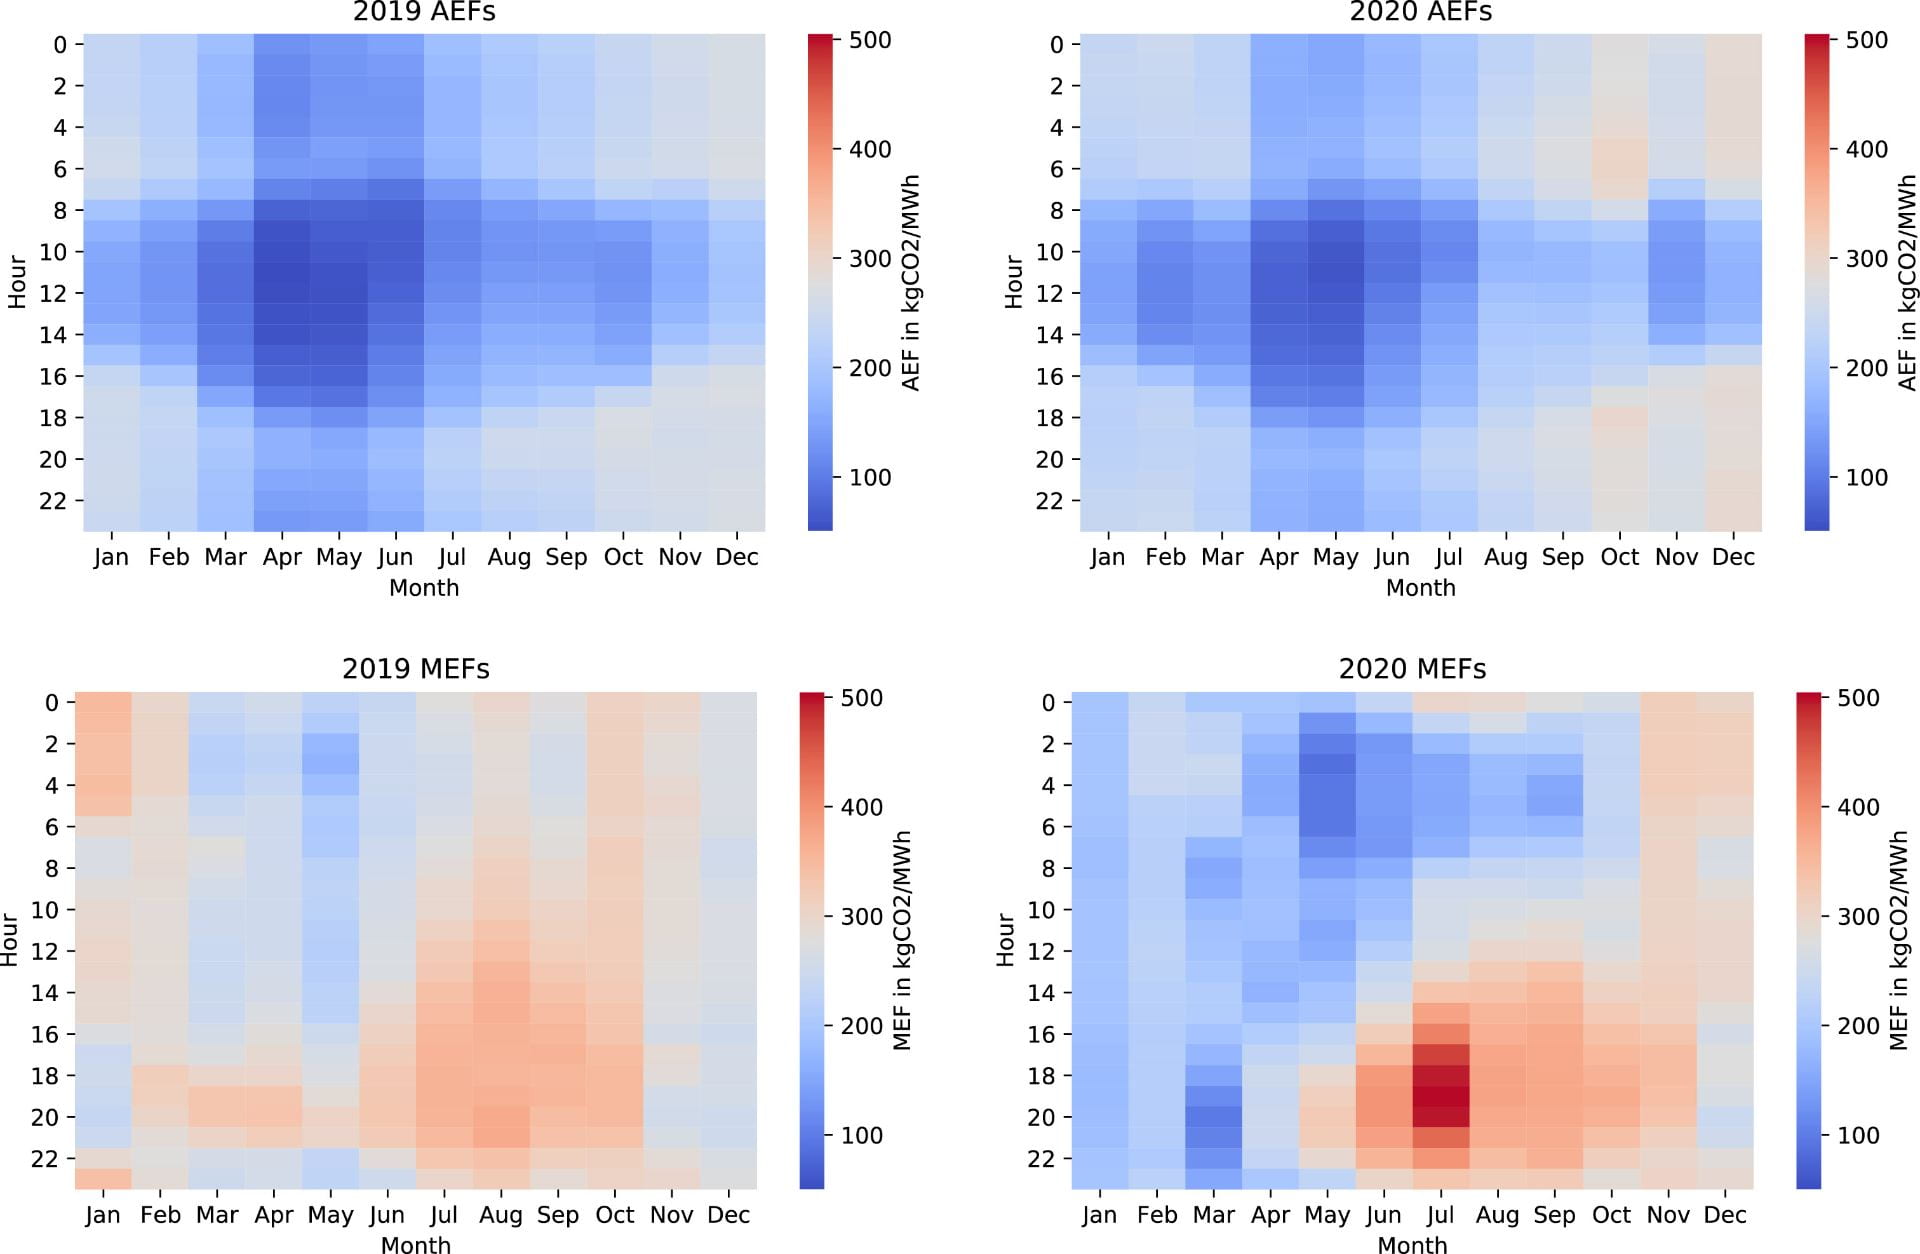
[Figure above] Demand side-management strategies are becoming increasingly important for balancing variable renewable electricity generation. However, since DSM impacts the activity of the “marginal generator”, not the operation of the grid as a whole, accurately estimating the emissions consequences of DSM requires use of a Marginal Emissions Factor (MEF). Here we develop a new method of calculating MEFs and demonstrate the method for the California Independent System Operator. In the figure above, we compare MEFs to CAISO grid-wide Average Emission Factors (AEFs) and note large differences, suggesting that using AEFs to estimate the emissions consequences of DSM is not best practice. Check out the 2022 paper in Journal of Cleaner Production here.
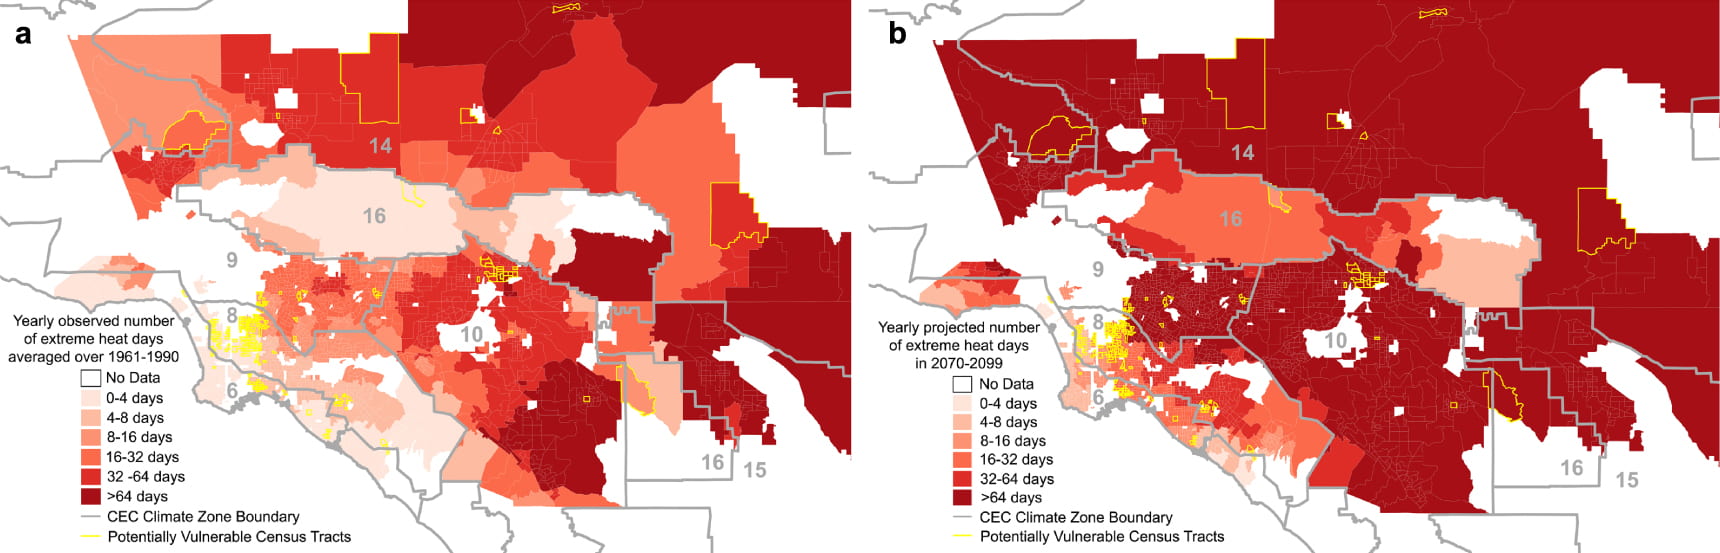
[Figure above] In this paper, we use smart meter electricity usage, climate, and socio-economic data to identify the populations that are most vulnerable to extreme heat. See 2020 publication in Environmental Research Letters here.
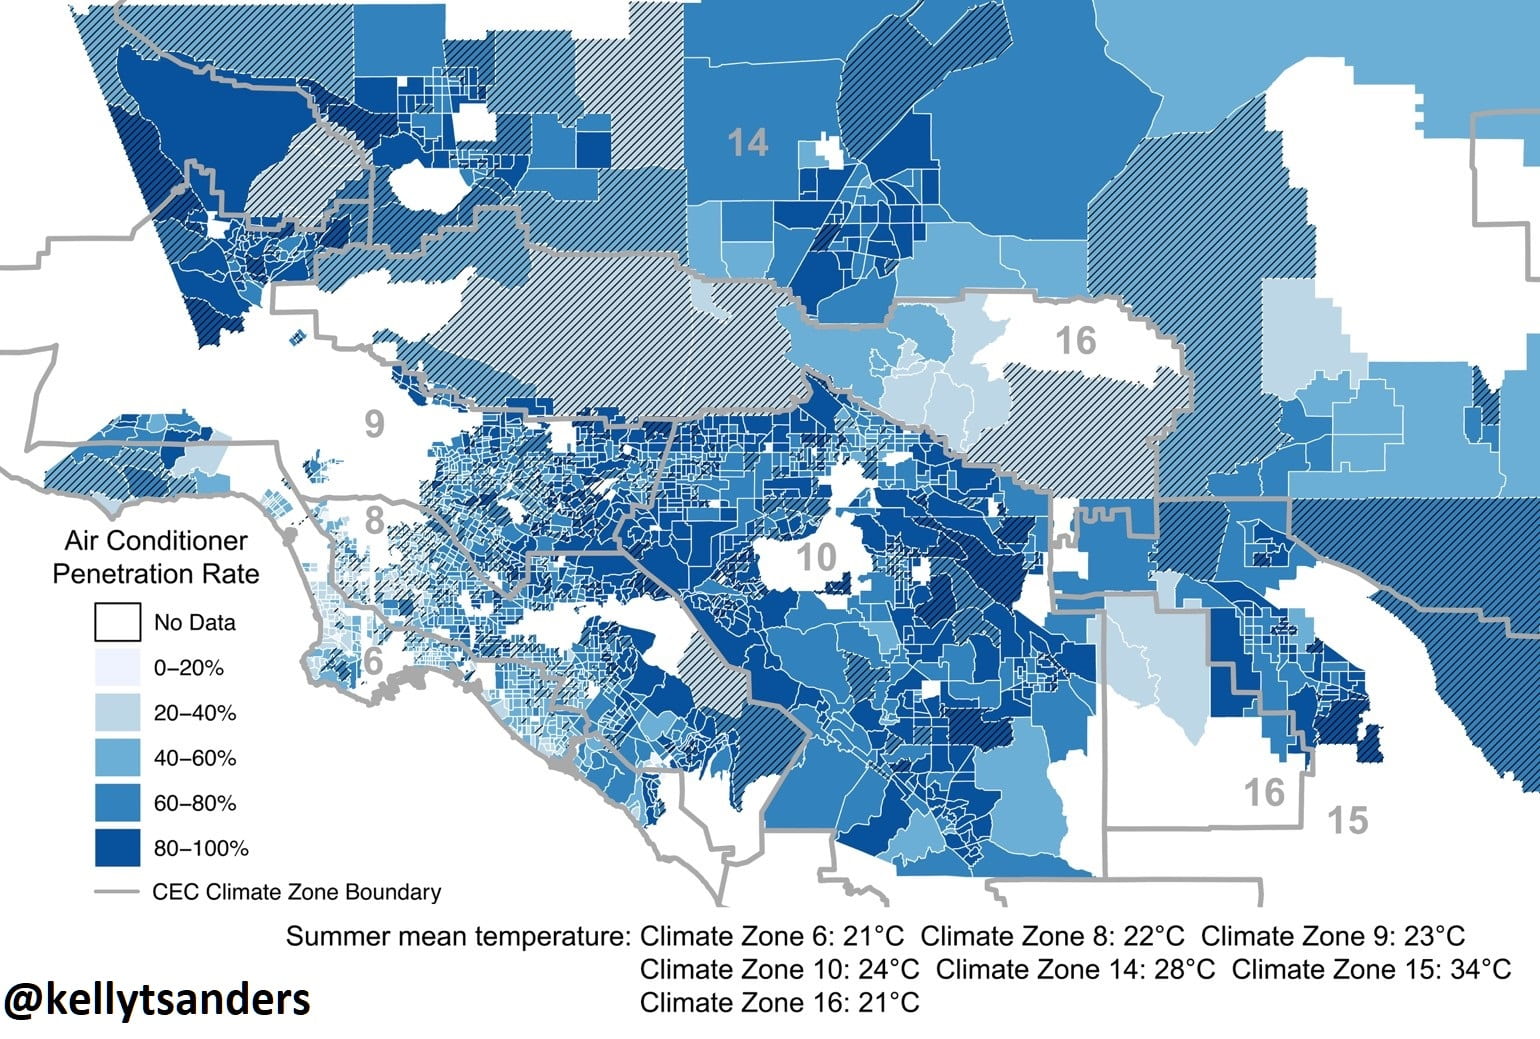
[Figure above] Air-conditioning is an important and growing electricity load. It is also a critical intervention to protect people from extreme heat. Despite this, we have a very poor understanding of AC access at the household level. In this body of work we develop a framework for identifying homes that use air-conditioning and apply this framework in our 2019 paper to quantify AC penetration across the Los Angeles metropolitan region.
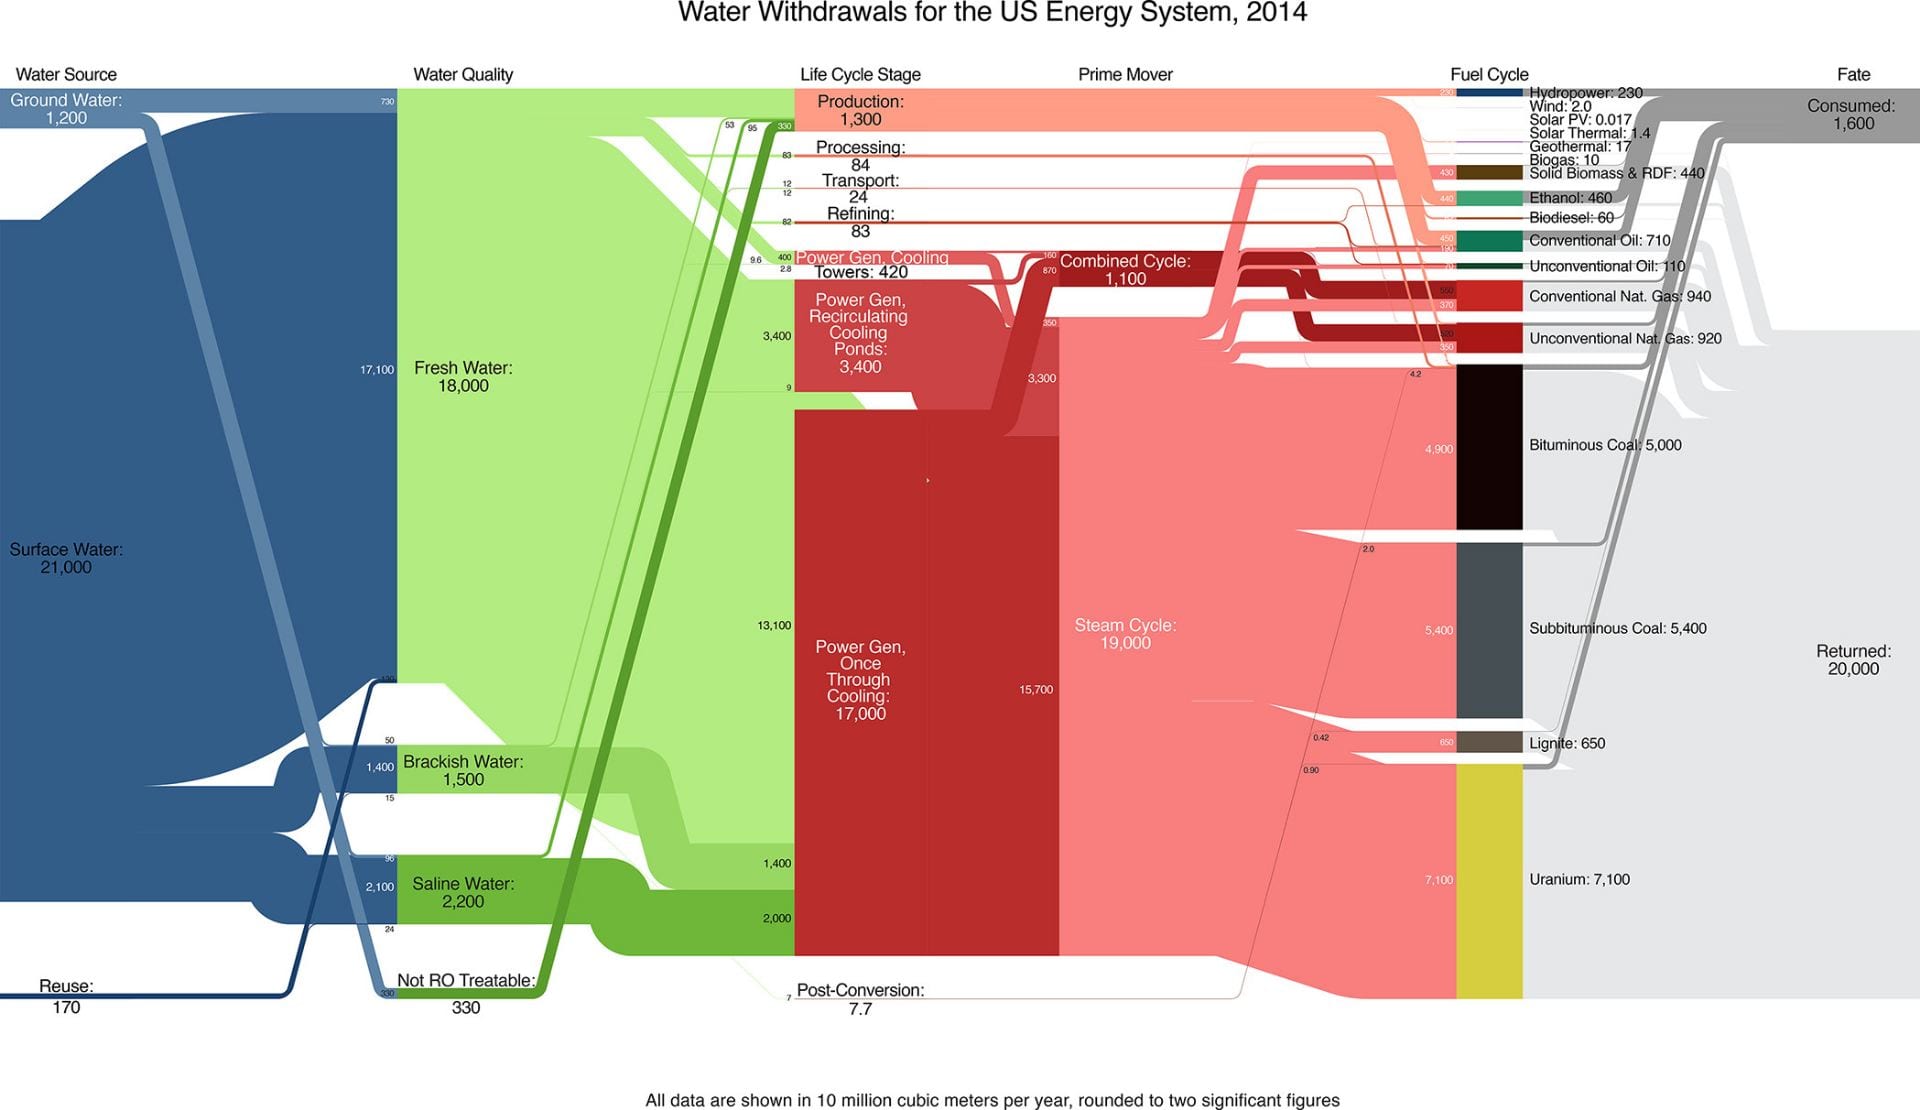
[Figure above] How much water does the US energy system withdraw and consume? In this analysis, we present the first detailed estimate of this water usage at the national scale. Included is a 200 page SI of absolute and water intensity data that we hope will be of value to the research community. To learn more, check out the 2018 ES&T paper published here.
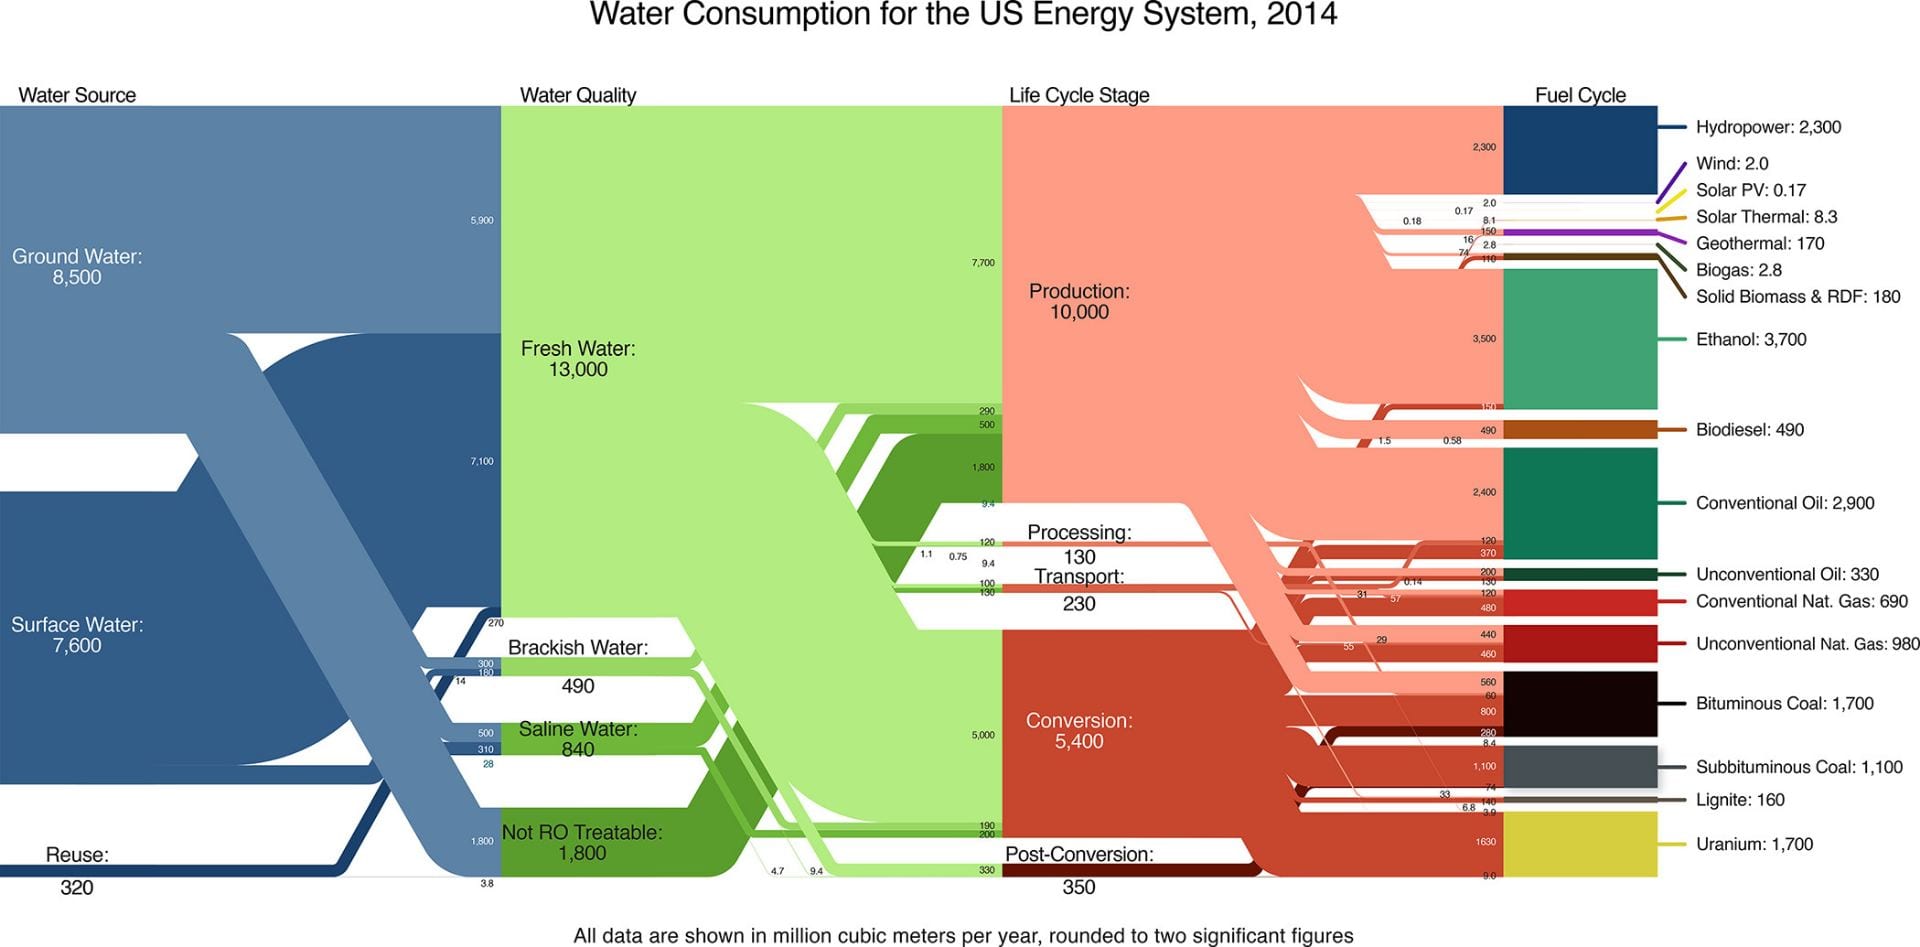
[Figure above] The US Energy system represents approximately 10% of total US water consumption, annually. Producing primary energy, particularly irrigated corn for ethanol and oil production, represents a significant fraction of this water usage. To learn more, read our 2018 paper in ES&T here.
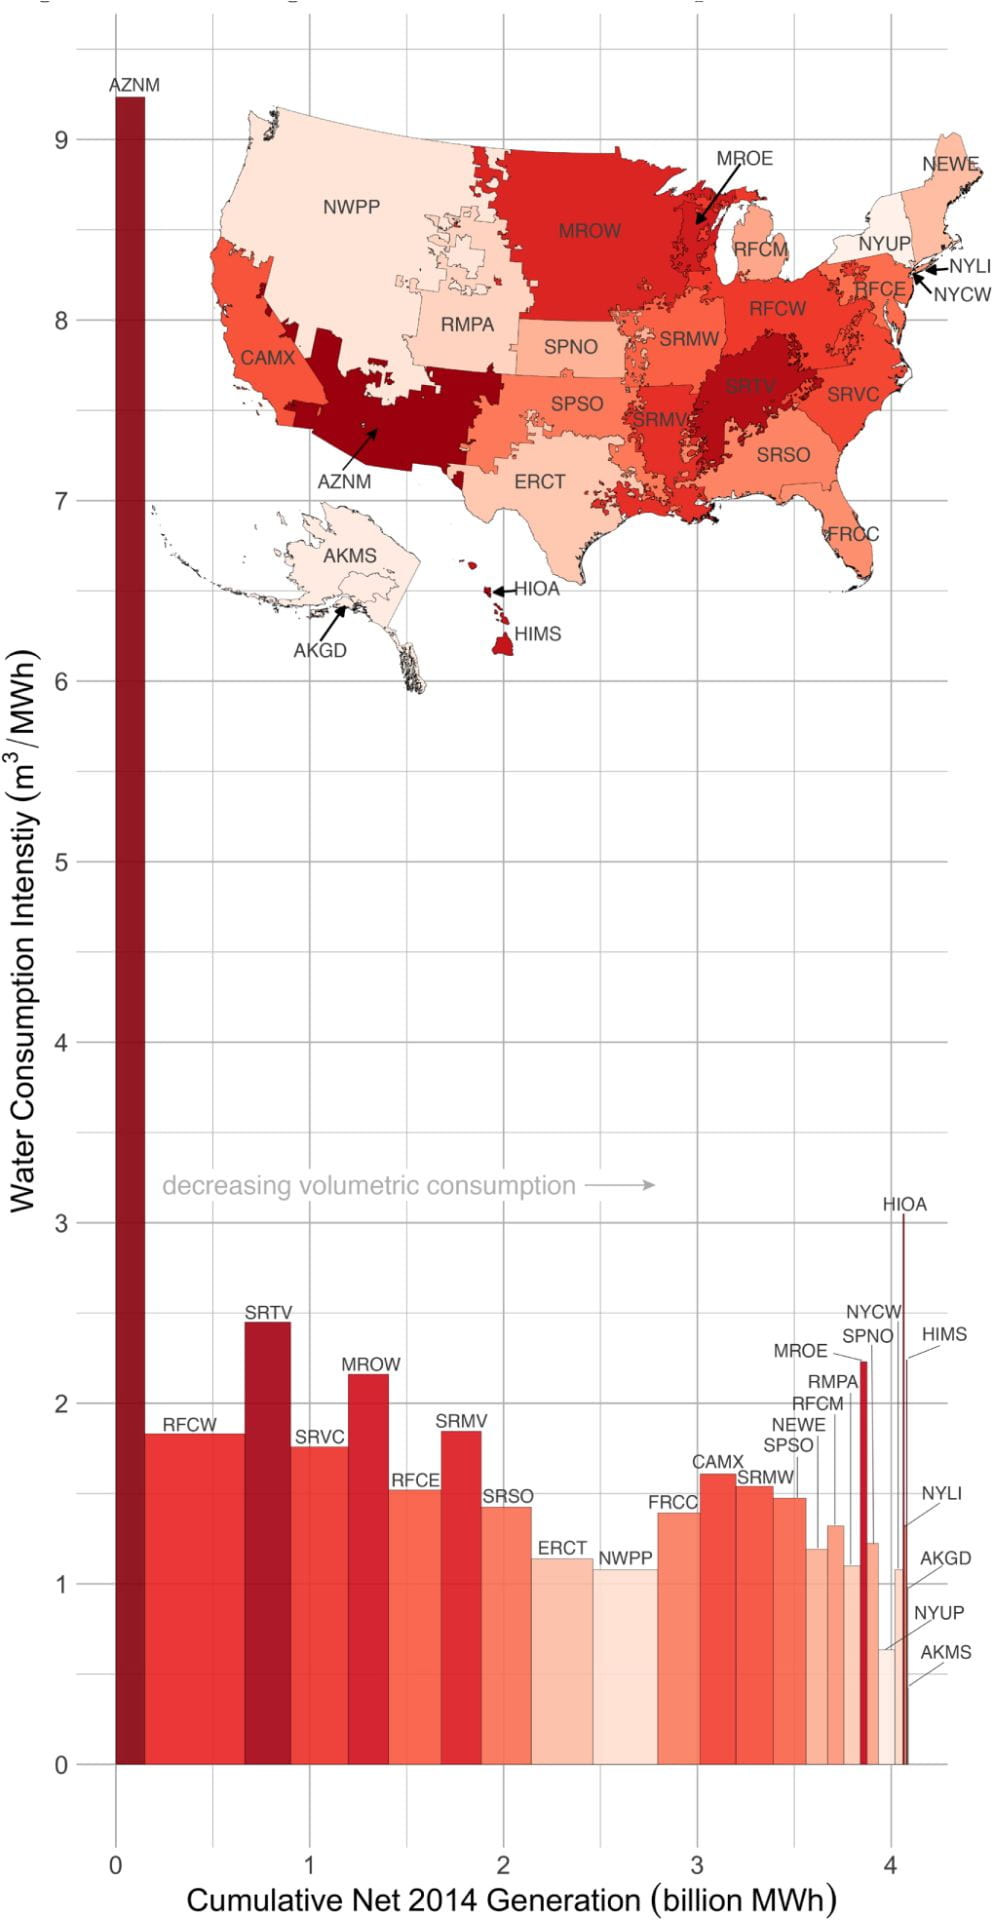
[Figure above] The water consequences of electricity consumption are a function of regional power generation fleets. In this paper published in Environmental Research Letters in 2019, we quantify regional water consumption and consumptive intensities by US eGRID region using 2014 as a base year.
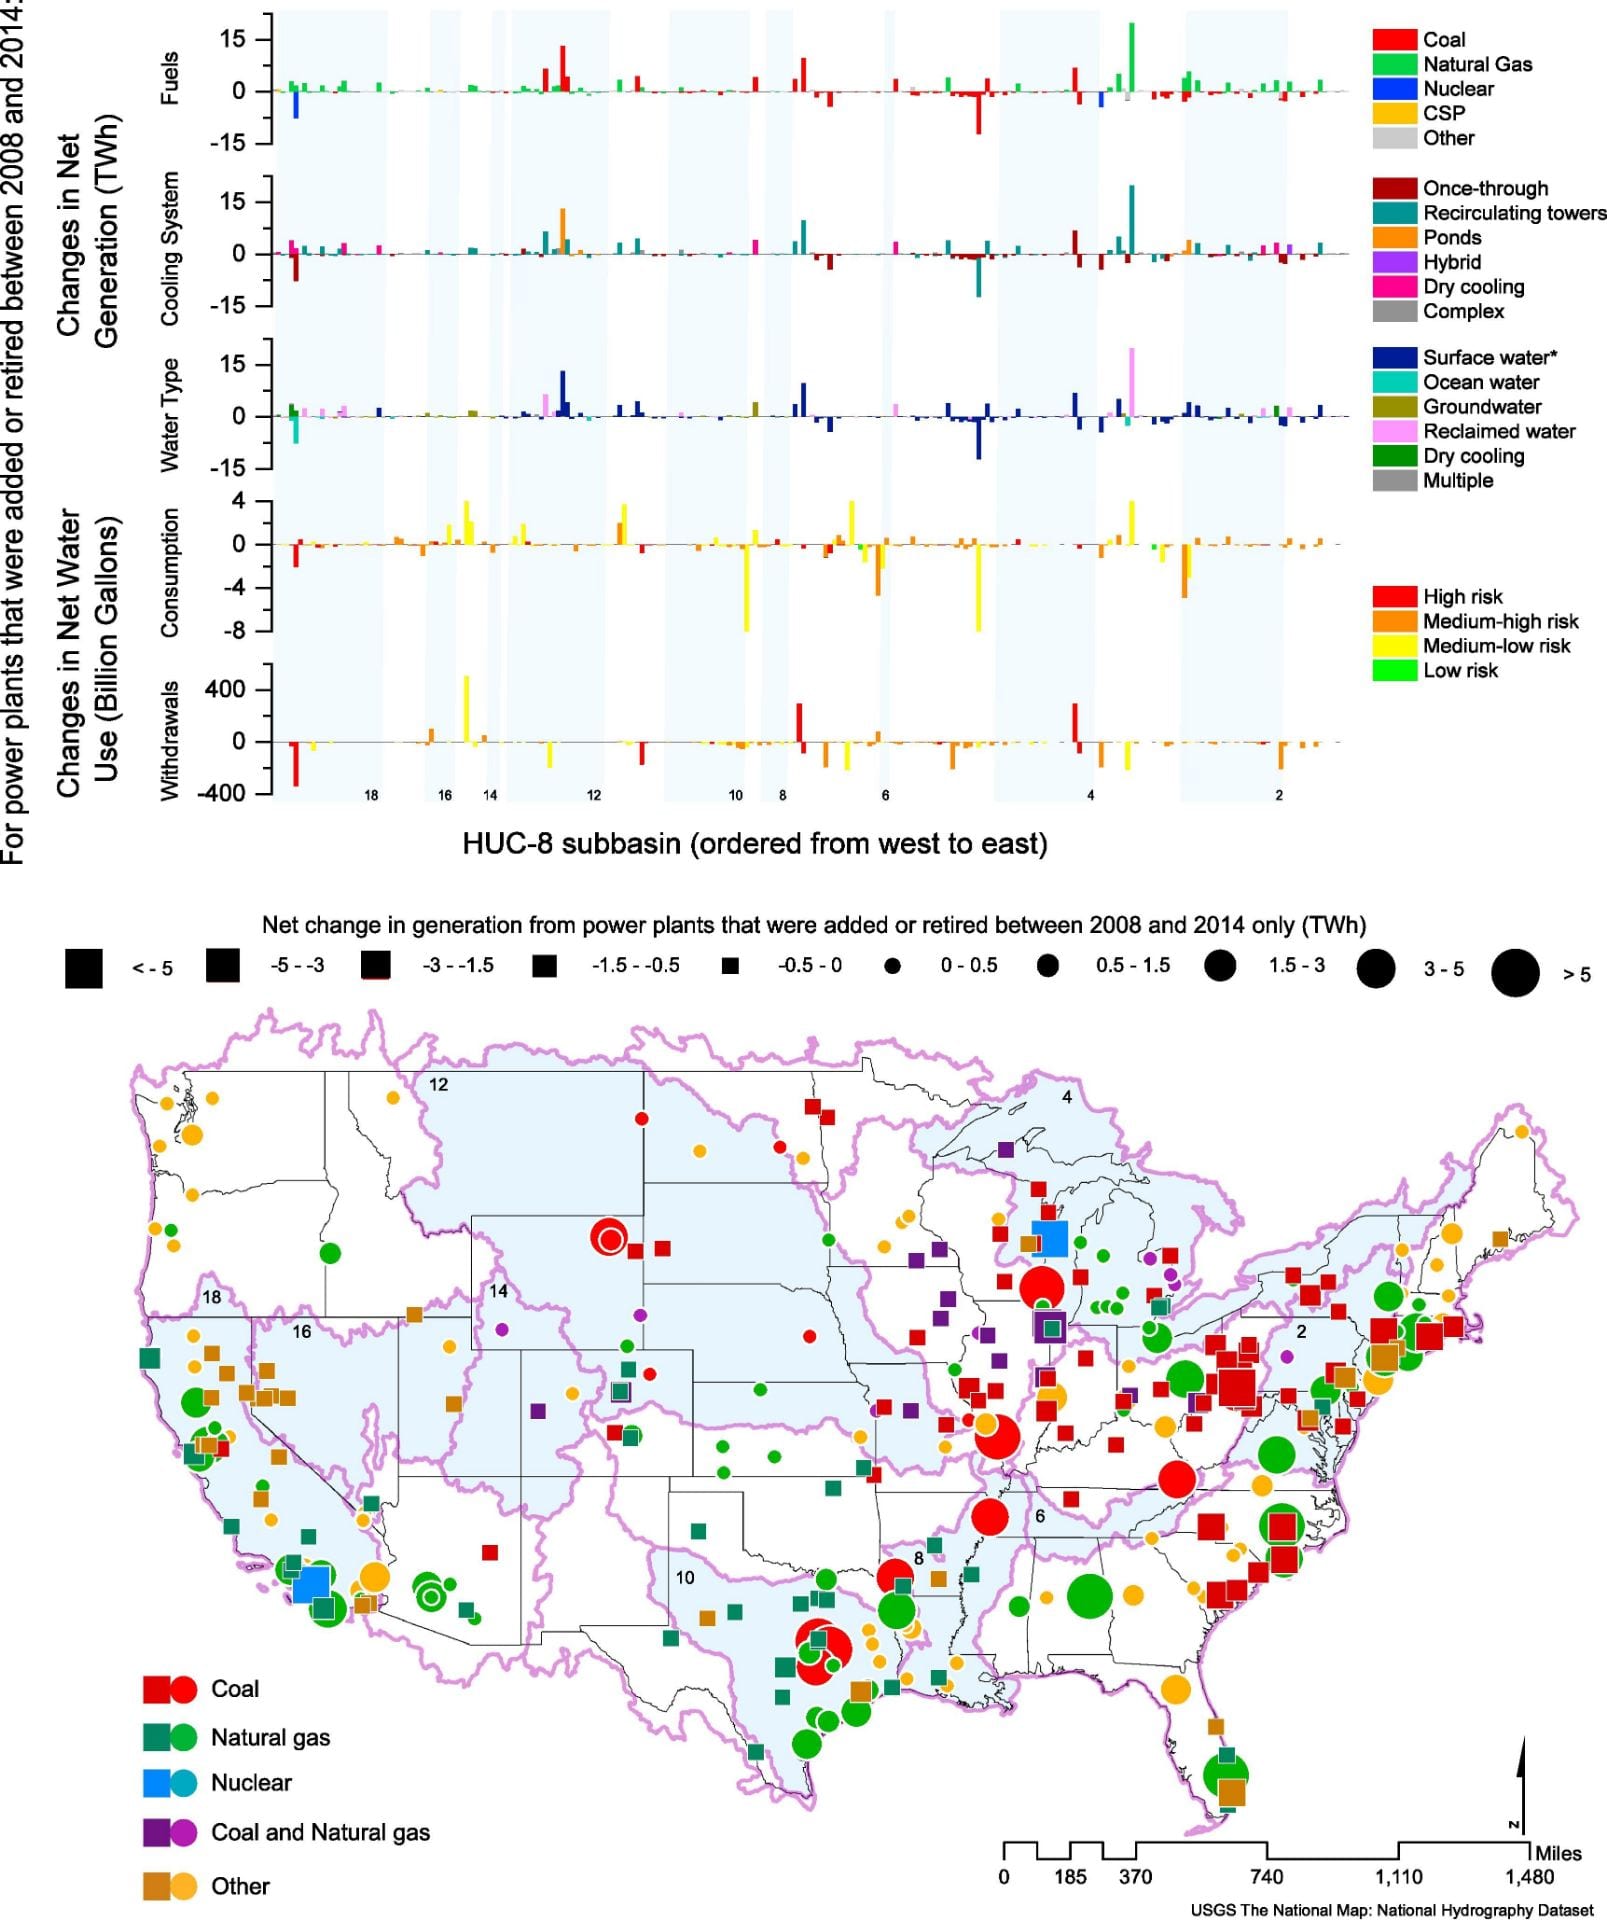
[Figure above] The US power sector has been experiencing rapid fuel and technology transformations in recent years. Cheap natural gas due to advances in hydraulic fracturing and the declining costs of renewables have put pressure on existing coal plants, while changes in cooling technology preferences have resulted in the retirement of once-through cooled power plants. How have these changes affected regional water use? Check out the map above and learn more in our 2018 Applied Energy paper here.
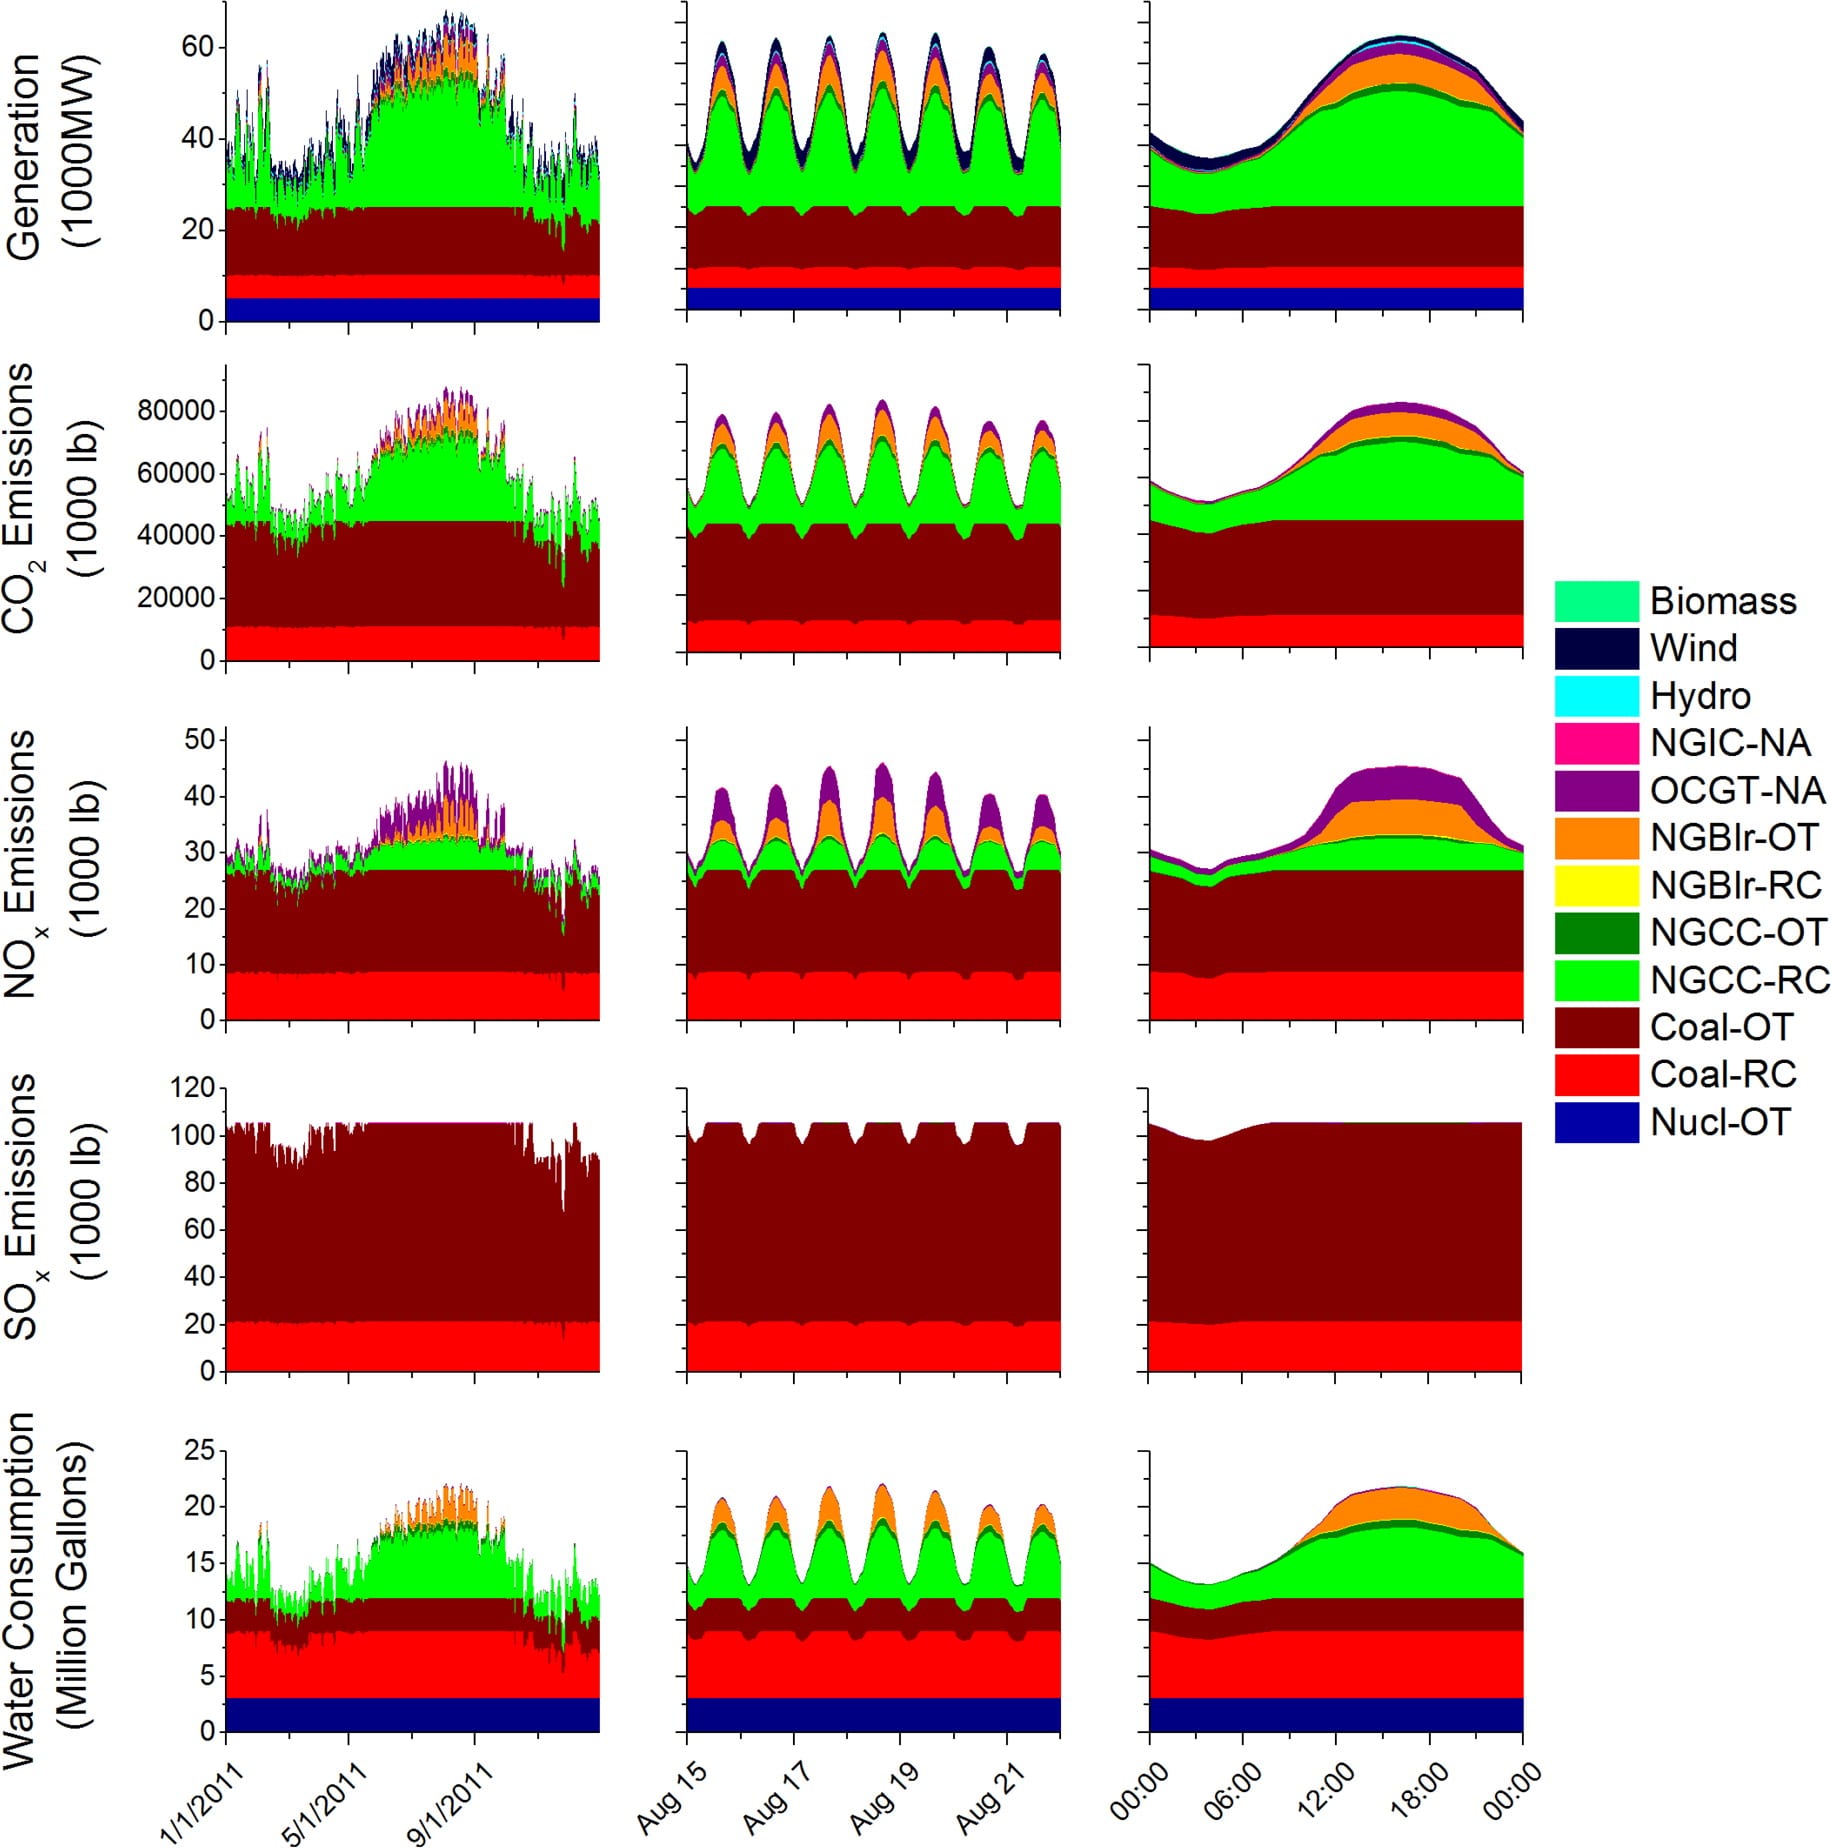 [Figure above] The Electric Reliability Council of Texas power grid represents a significant fraction of the region’s emissions and water use. Due to the nature of standard datasets, evaluating the overall air, climate, and water impacts of power plants on meaningful temporal scales is difficult. Similarly, since the fleet of generation plant is constantly changing, determining the environmental impacts of generating a unit of electricity is even more challenging. Here we create methods to evaluate multiple environmental criteria with very high spatio-temporal resolution for comparison. Check out the full paper, published in ES&T in 2016 here.
 [Figure above] Did you know that the US consumes nearly 13% of its total annual primary energy consumption on direct water and steam services? That is 25% more energy than is used for lighting in the Residential and Commercial sectors making the water sector an important opportunity for energy conservation. Read the full 2012 paper here.
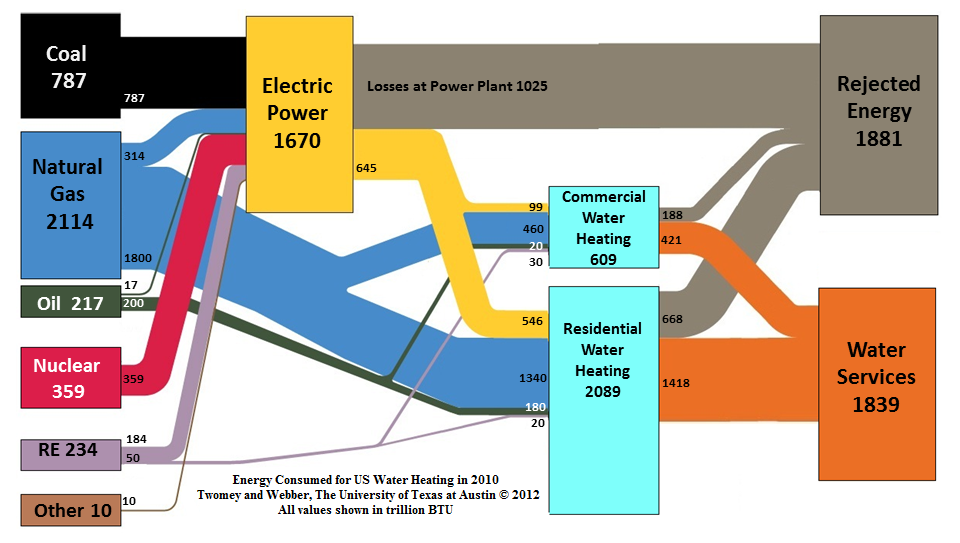
[Figure above] Water heating represents nearly 4% of US annual primary energy consumption. Nearly half of the energy consumed for water heating is lost as waste heat. How can we do better? Read more here.